Drawdown of Soil Phosphorus by Crop Removal

Drawdown of Soil Phosphorus by Crop Removal
Definition
Cropping without phosphorus (P) fertilization is one of the few options available to growers to reduce soil test P while maintaining high-yielding row crops or pasture. This practice focuses on the rate component of nutrient management. The purpose of nutrient management is to provide sufficient nutrients for crop production and ensure an economic response, while minimizing off-site losses of these nutrients. The agronomic and environmental objectives of nutrient management are met by making the best use of available nutrients. In cases where P has been overapplied, best use equates to not applying additional P for some amount of time.
Purpose
The purpose of soil P drawdown is to decrease soil test P by mining P already present in the soil through crop harvest over time. This practice is typically applied when soil test P concentrations dictate low to no probability of response to additional P (i.e., very high, or excessive). During soil P drawdown, growers use nutrients already present in the soil, allowing plants to decrease soil test P concentrations and reduce potential for off-site P losses from agricultural fields.
How Does This Practice Work?
When P applications to a field cease, the soil test P will eventually decline as crops remove P during growth and this P is removed from the site with harvest. After managing soils under a P drawdown strategy for some time, soil test P will return to a level where fertility recommendations would indicate a probable crop yield response to added P fertilizer. The duration of time that soil should be managed under P drawdown strategy to sufficiently lower soil test P varies based on the soil test P concentration when the P drawdown begins and the P needs of the crops grown.
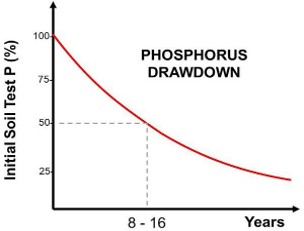
Fig. 1. Soil test phosphorus temporal drawdown as a percentage of soil test phosphorus levels.
Gatiboni et al. (2025) combined published data from 56 fields (meta-analysis) to determine the amount of time it takes to achieve soil test P drawdown. Soil test P drawdown did not follow a straight line (linear). Instead, soil test P drawdown was best described using exponential decay model (Figure 1); soil loss of P is rapid when soil test P is high, but the reduction rate slows as soil test P gets closer to baseline levels. The general exponential decay model is expressed as:
y = a·e-bx
where:
y = percentage of the initial soil test P remaining in the soil after x years
x = number of years of P drawdown (zero P inputs)
a = The fitted starting percentage
b = the P drawdown rate constant
e = Euler’s number (2.71828).
Four drawdown equations were generated using the published data to represent four ranges of initial soil test P concentrations:
- Low (Initial Mehlich-3 soil test P = 6–29 mg kg-1): y = 98.4396 e-0.0855x
- Medium (Initial Mehlich-3 P = 30–66 mg kg-1): y = 98.9997 e-0.0681x
- High (Initial Mehlich-3 = 67–115 mg kg-1): y = 100.8341 e-0.0726x
- Very High (Initial Mehlich-3 = 116–261 mg kg-1: y = 98.5830 e-0.0564x
Based on these relationships, the researchers estimated that the number of years necessary to reduce soil test P (as measured following Mehlich-3 extraction) by 50% is approximately 8.4, 12.0, 9.5, and 15.9 years when soil test P falls into the low, medium, high, or very high categories listed above. For example, it will take approximately 15.9 years to reduce Mehlich-3 soil test P from 200 mg kg-1 to 100 mg kg-1. These drawdown year estimates provide a simple way to gauge how long P fertilizer should be withheld to draw down soil test P based on the initial Mehlich-3 P concentration. For more accurate estimates, landowners, agronomists, and environmental policy managers can directly use the predictive equations generated by this meta-analysis.
How to Use the P Drawdown Equations
The drawdown equations can be used to 1) estimate the soil test P after a defined amount of time (x) or 2) estimate the number of years (x) to reach a specific target soil test P.
To estimate the soil test P after a defined amount of time:
- Choose the equation: Determine the initial Mehlich-3 soil test P concentration and select the corresponding equation.
- Choose the Timeframe (x): Select the number of years of zero-P application you want to project (e.g., x = 5 years).
- Calculate the percentage of the original soil test P (y) remaining after x years: Plug “x” years into the appropriate equation.
- Convert to Estimated Soil Test P (in mg kg-1 or ppm): Multiply the initial soil test P concentration by the calculated percentage (y) and divide by 100.
Example:
- Current Soil Test P: 150 mg kg-1. Use the “very high” equation
- Timeframe (x): 5 years
- Calculate y: y = 98.5830·e(-0.0564 × 5) = 98.5830·e-0.2820 = 74.3%
- Convert y to Estimated soil test P: 150 × 0.743 = 111.4 mg kg-1
After 5 years, 74.3% of the original soil test P remains, bringing the soil test level down from 150 mg kg-1 to 111 mg kg-1.
Alternatively, land managers can estimate the number of years required to deplete soil test P to a desired, environmentally safe agronomic thresholds through crop removal by following these steps:
- Choose the equation: Determine the initial Mehlich-3 soil test P concentration and select the corresponding equation.
- Choose the Target Soil Test P: Identify the desired soil test P endpoint.
- Calculate the Target % of Initial Soil Test P (y): Divide the target soil test P by the initial soil test P, then multiply by 100.
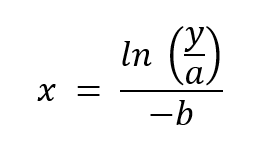
- Calculate years to reach the Target % (x): Plug the Target % (y) into this inverted equation.
Example:
- Current Soil Test P: 150 mg kg-1. Use the “very high” equation.
- Choose the Target Soil Test P: 50 mg kg-1
- Calculate the Target % (y) = (50/150) × 100 = 33.33%
- Calculate years to reach the Target % (x) =

Where This Practice Applies and Its Limitations
Generally, this practice applies in all fields but should be used primarily when soil test P concentrations are above the concentration needed for crop production and response to added P is unlikely.
The application of the drawdown equations is for estimation purposes only. These equations were derived empirically using data from studies involving row crops and pastures where no P fertilizer was applied. Although crop removal is expected to influence the rate of drawdown, the analyzed dataset did not provide sufficient information to include crop type or P removal rate as model variables. Consequently, the equations represent average drawdown trends, and actual drawdown rates may vary depending on crop species, yield level, and the intensity of P removal.
Finally, the dataset used to develop these equations included soils with initial Mehlich-3 soil test P concentrations ranging from 6 (low) to 261 mg kg-1 (very high). Therefore, predictions should be used with caution for soils with soil test P values outside this range.
Effectiveness
This practice can be very effective in lowering excessive soil P. However, it can take some time to lower P, depending on how high the soil test P concentrations are when drawdown begins.
Cost of Implementing the Practice
There is generally no cost associated with this practice, and it can potentially save growers money. In situations where growers are using organic fertilizer sources, such as manure, they must transition to using inorganic fertilizer without P to successfully implement soil P drawdown, which may result in costs associated with obtaining and applying a different type of fertilizer.
Operation and Maintenance
There is no operation or maintenance associated with soil P drawdown, although drawdown in conjunction with soil conservation can yield the greatest protection for water quality (Mott et al., 2025).
References
Gatiboni, L., A. Shober, N. Fiorellino, D. Osmond, and L. Mosesso. 2025. Drawdown of soil phosphorus by crop removal: A meta-analysis of 56 fields with halted fertilization. A&EL. DOI: 10.1002/ael2.70007.
Mott, J., Z.P. Simpson, C.H. Bolster, J. Faulkner, K. King, W. Osterholz, M. Williams, B. Dalzell, G.W. Feyersen, C.L. Delph, G. Miner, L.F. Duriancick, and P.J.A. Kleinman. 2025. Combining soil conservation with phosphorus drawdown can confront legacy phosphorus accumulation and transfer. J. Soil Water Conservation. doi.org/10/10.1080/00224561.2025.2492525.
Current Authors
| Luke Gatiboni NC State University [email protected] Deanna Osmond Laura Mosesso |
Amy Shober University of Delaware [email protected] Nicole Fiorellino |
Editing and Design
| Deanna Osmond NC State University |
Forbes Walker University of Tennessee |
Citation:
Gatiboni, L., A. Shober, N. Fiorellino, D. Osmond, and L. Mosesso. 2026. Drawdown of Soil Phosphorus by Crop Removal. SERA17 Phosphorus Conservation Practices Fact Sheets.https://sera17.
Funding for layout provided by SERA-17
Published: Aug 12, 2026